When I was making my rounds of reading the news online yesterday I ran into an interesting article that listed all of the turnout rates for each state for the 2004 election. Of course, I wanted to see who was the highest (Minnesota @ 77.3%), lowest (Hawaii @ 48.9%), and where Washington ended up (65.4%). So, this got me thinking when I was talking to Aaron about what I found online. My thinking lead to wondering how each of these states voted when ranked by percent turnout. So, here I present to you how each state voted electorally, ranked by percent turnout.
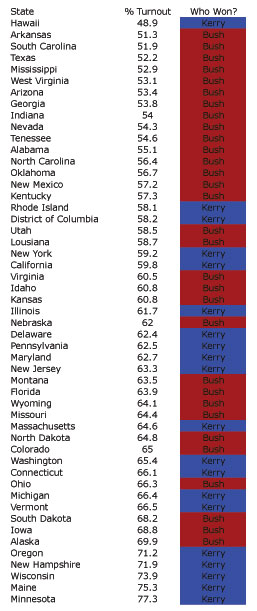
Table 1: Ranked by % Voted
So, I find this kind of interesting. Now, I am not going to draw any conclusions about this. But, I do find it interesting to see that the top five states voted for Kerry, while the bottom fifteen (minus Hawaii) voted for Bush. Now, even these states had over 50% turnout, only Hawaii didn’t.
Overall, it was a good year for voting. It was the highest turnout (60.4%) since 1968. So, that is something to be proud of, if you voted. This is up 6.4% from the election in 2000. To put it in perspective, that turnout totaled 122.3 million voters according to CASE. Pretty impressive if you ask me.
Link: CASE